 330-526-8944
  info@storeyassociates.com
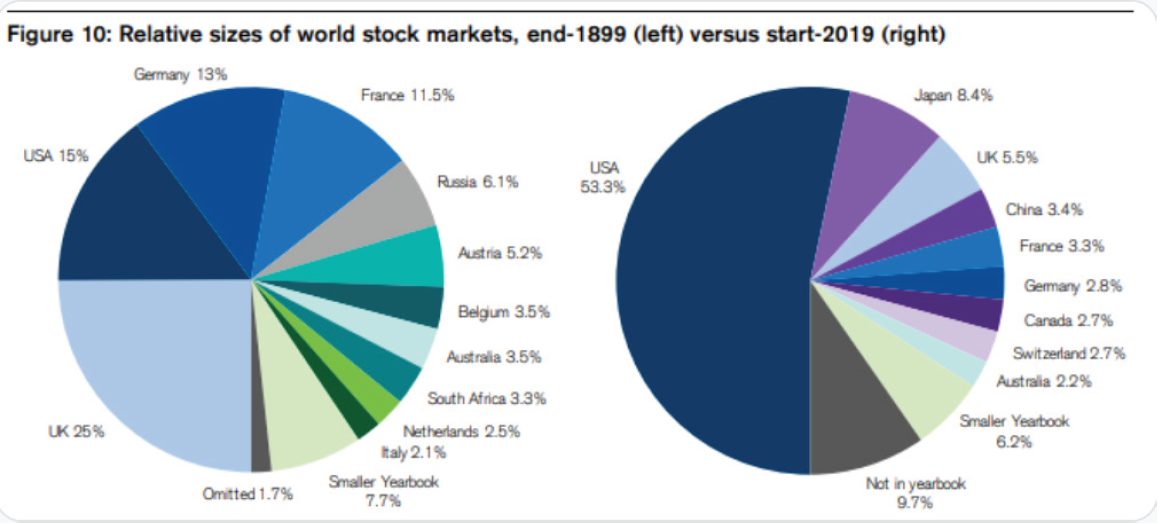
Ever wonder how the balance of the world’s economies have changed over the last 120 years? Here’s a really interesting snapshot (see graphic), which shows the size of many countries’ stock markets at the beginning of the 1900s (as a percentage of the total), and as of the start of this year. Notice the enormous growth of the U.S., from 15% of the total to more than 50%. Also notice that much of this growth came at the expense of European economies, notably the UK (down from 25% to 5.5% over the past 120 years), Germany (13% down to 2.8%) and France (11.5% to 3.3%). Russia and Austria were significant at the end of 1899; less so now.
Also notice some of the risers: Canada, Switzerland and China. It makes you wonder what the same chart will look like at the end of 2099.
Provided by Storey & Associates, a Registered Investment Advisor located at 1360 South Main Street, North Canton, Ohio offering Financial Planning and Investment Management Services. Content written by Bob Veres. For more information, please contact us at (330) 526-8944 or info@storeyassociates.com.
Copyright © 2026 Storey & Associates. All rights reserved.


 Client Vault Login